
.svg)
A security architecture diagram is a boxes-and-arrows drawing of a system: boxes for the key components, arrows for the data flows or network flows between them, trust boundaries marked as zones, and security controls annotated where they apply. Creating one takes six steps: list the key components, draw the connections, label each flow, mark the zones, annotate the controls, and add the security and monitoring plane.
At a glance
- Boxes: key components only (servers, databases, endpoints, security tooling), not every host
- Arrows: data flow or network flow, labeled with protocol and port; the two flows sometimes run in opposite directions
- Zones: trust boundaries drawn as bounded regions (user, internet, DMZ, application, data, security and monitoring)
- Controls: annotated at the component or boundary they protect
- Who asks for it: security architecture reviews, SOC 2 and ISO 27001 audits, customer security questionnaires
- Tools: draw.io (free), Lucidchart, Visio; the conventions matter more than the tool
Here is the finished product this guide builds toward, for a typical public web application:
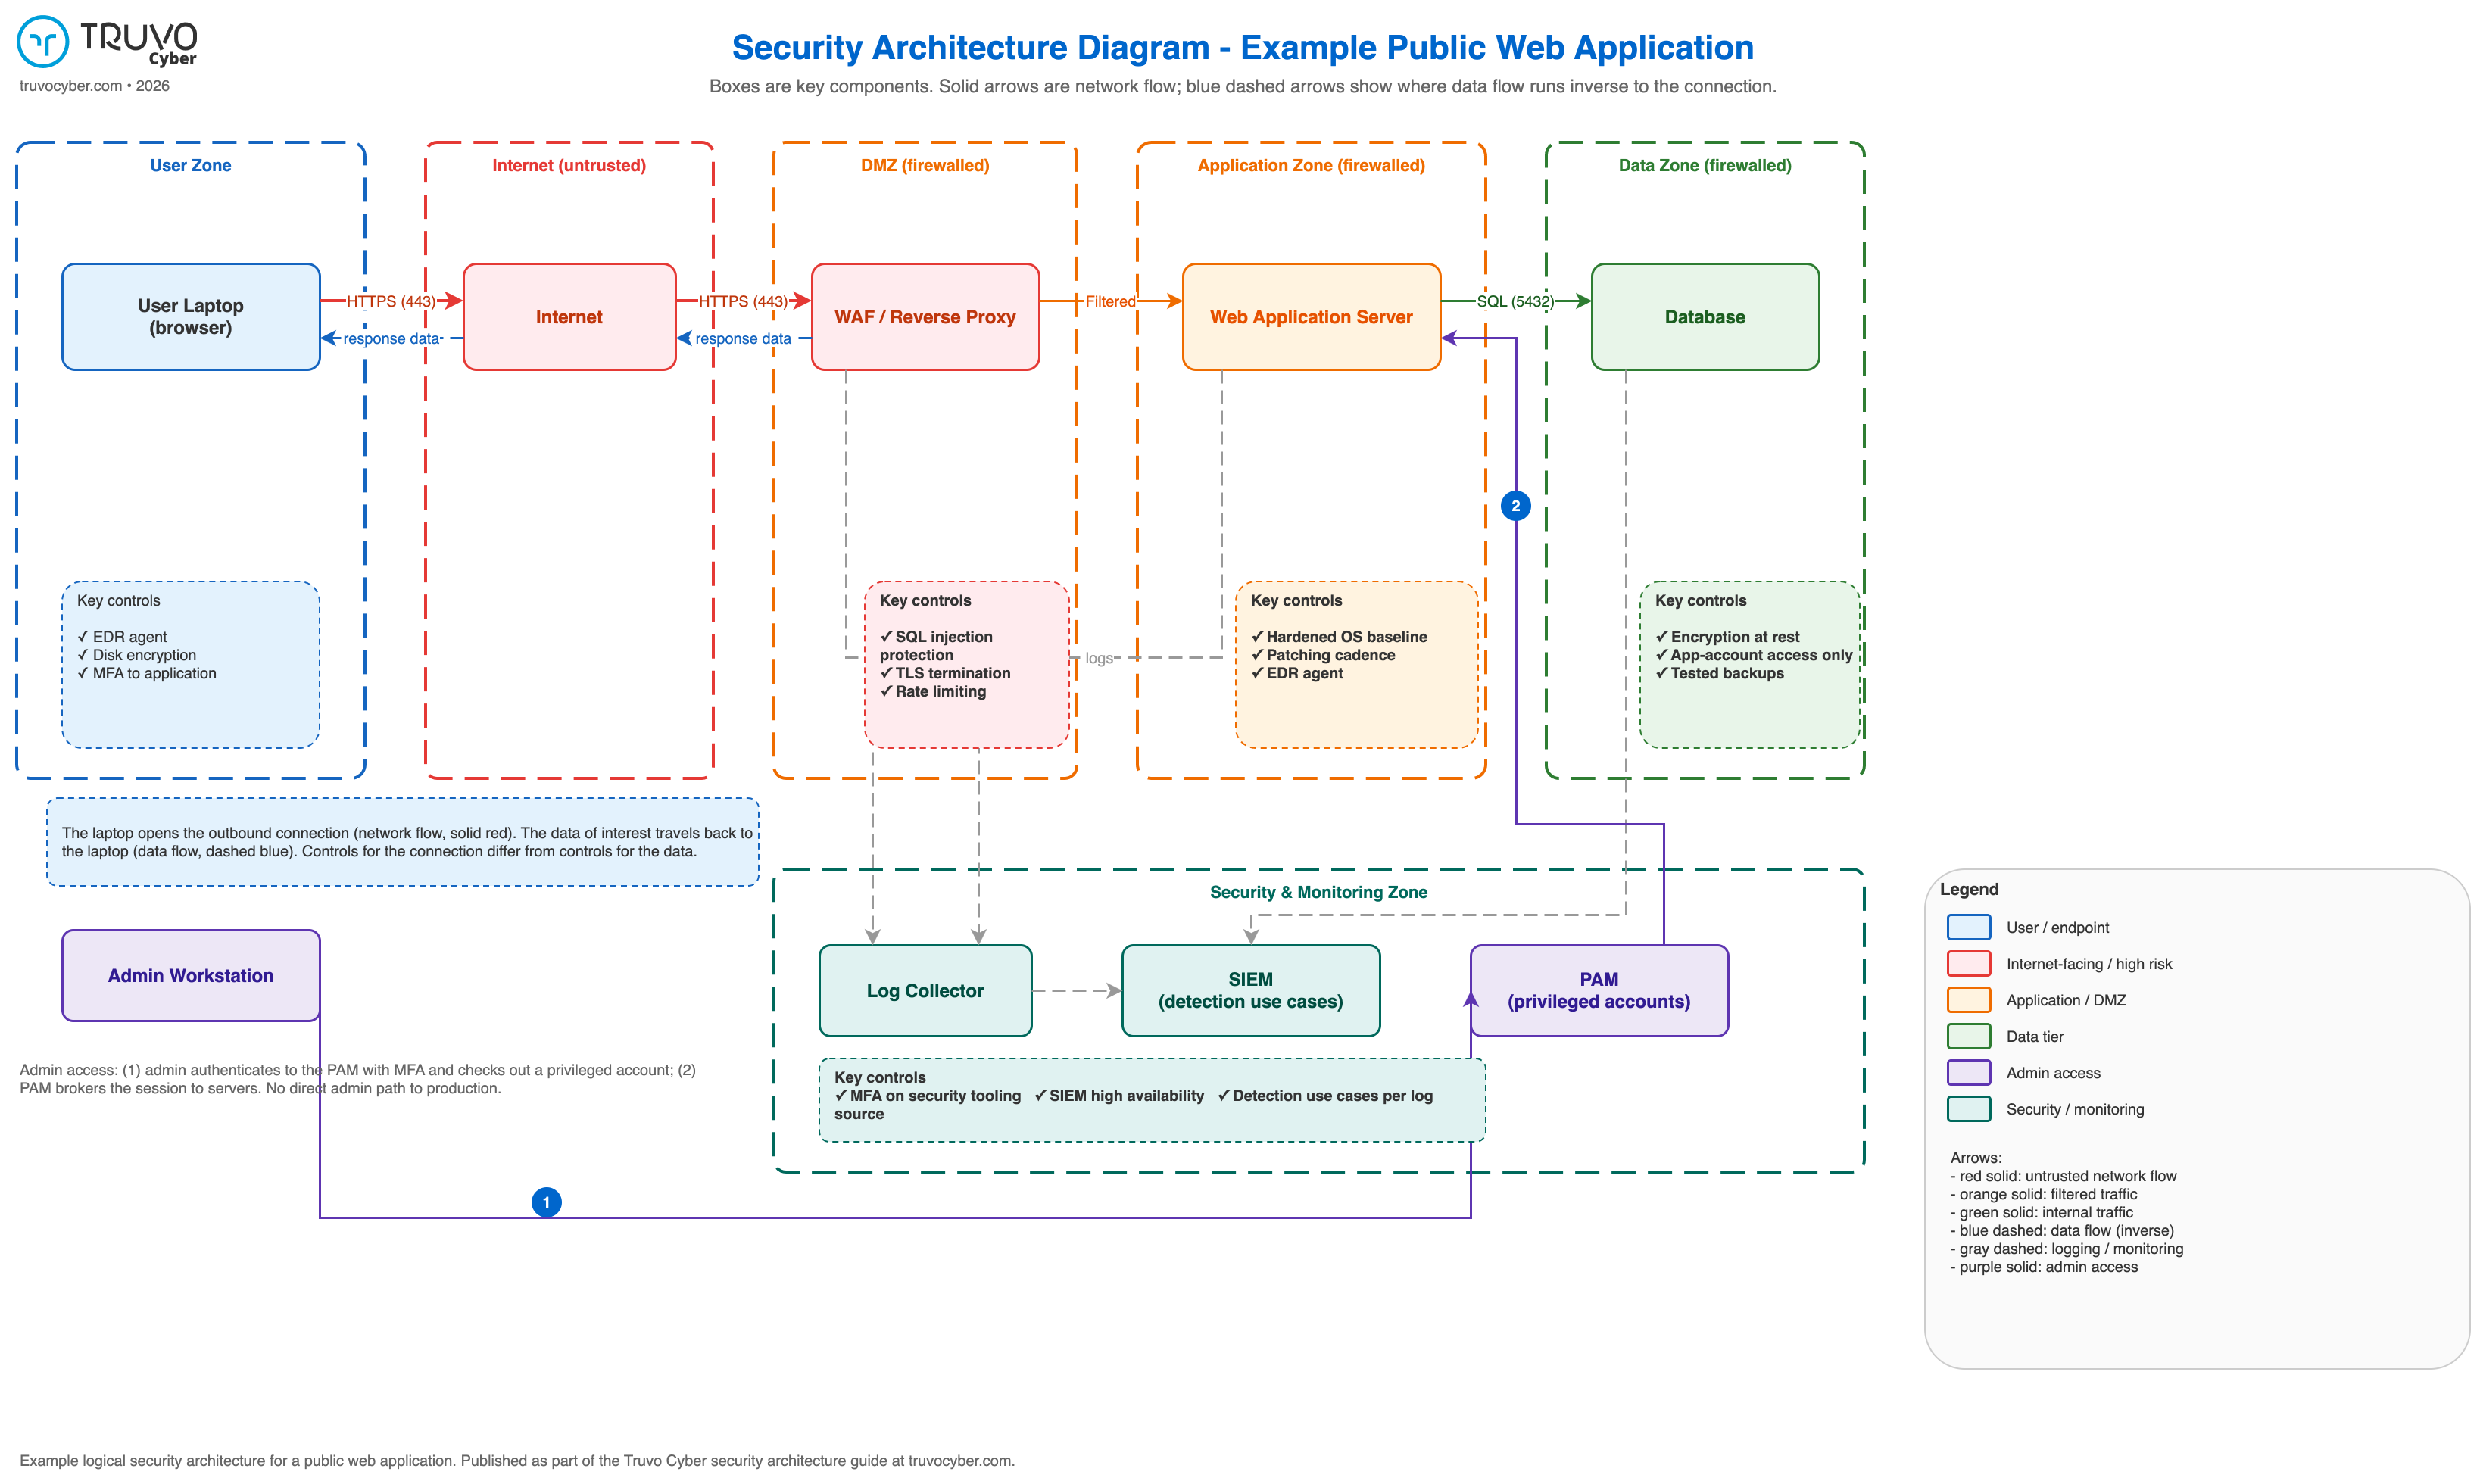
Figure: the worked example this guide builds, with zones, labeled flows, inverse data flow, and the security and monitoring plane. Click the diagram to enlarge it.
What do the boxes and arrows mean?
In a security architecture diagram, boxes represent key components: the systems that matter to how the application works and how it could be attacked. A user laptop, a WAF, a web application server, a database, a log collector, a SIEM, a PAM. A diagram that shows all forty microservices communicates less than one that shows the six that handle the sensitive data.
Arrows represent either data flow or network flow, depending on what the diagram needs to show, and the difference matters because the two sometimes run in opposite directions. A laptop makes an outbound network connection to a web server, so the network-flow arrow points from laptop to server. But the data of interest, the response, travels from the server back to the laptop. Controls for the connection (firewall rules, TLS) differ from controls for the data (what leaves, where it is stored, who can read it), and a reviewer needs to see both. The worked example above draws network flow as solid arrows and inverse data flow as dashed blue arrows, which keeps both readable on one page.
How to draw a security architecture diagram, step by step
- List the key components. Pull from the three discovery sources: SME interviews, existing documents and diagrams, and technical discovery (cloud enumeration scripts, or network traffic capture on-premises). Include the security tooling: the log collector, SIEM, and PAM belong on the diagram because they are components with connections, not annotations.
- Draw the connections. One arrow per meaningful connection. Point network-flow arrows in the direction the connection is opened.
- Label every flow. Protocol and port: HTTPS (443), SQL (5432). Where the data of interest runs inverse to the connection, add the data-flow arrow or a note saying so.
- Mark the trust boundaries. Draw zones as bounded regions: user zone, internet, DMZ, application zone, data zone. Every arrow that crosses a boundary is a control point, and labeling traffic filtered is only honest after the filtering device, not before it.
- Annotate the controls. At each component, note the controls that protect it: hardening baseline, patching, EDR, encryption at rest. At each boundary crossing: the WAF rules, the authentication, the TLS.
- Add the security and monitoring plane. Logging paths from each significant component to the central collector and SIEM, and the admin access path through the PAM. A diagram without this plane shows a system nobody can watch or administer safely.
Key insight
The test of a finished diagram
Someone new to the system can trace a request end to end, name the trust boundaries it crosses, and say where its logs end up, without asking a single question.
The component-and-connection list the diagram encodes is the inventory, the ground truth of the security work that follows. Once the diagram exists, next actions tend to become obvious: ask of each component what it does, what could go wrong, and how to secure it, and ask of each connection what it does and how it is authenticated, authorized, and encrypted. Most systems reuse established designs, and the diagram is what shows which one applies.
What zones should a security architecture diagram show?
Zones represent trust boundaries: regions of the architecture where different levels of trust apply and where crossing requires a control. The set that fits a typical web application:
| Zone | Contains | Boundary control |
| User zone | Laptops, browsers, mobile devices | Endpoint controls (EDR, disk encryption) |
| Internet | Untrusted transit | None; everything crossing it is untrusted |
| DMZ | WAF, reverse proxies, load balancers | Firewall; filtering happens here |
| Application zone | Application and web servers | Firewall; only filtered traffic enters |
| Data zone | Databases, file stores | Firewall; application accounts only |
| Security and monitoring | Log collector, SIEM, PAM | Restricted admin access, MFA on the tooling |
Cloud environments keep the same logic with different names: VPCs and subnets play the zone role, security groups play the firewall role. The zones are logical, and one diagram at the logical level almost always beats a physically accurate one nobody can read.
What does an auditor or customer look for in a security architecture diagram?
SOC 2 and ISO 27001 audits, and most enterprise customer security reviews, ask for system and data flow diagrams directly. What the reviewer checks is consistency: does the access model in the diagram match the access policy, do the logging paths in the diagram match the monitoring evidence, is there a boundary between the internet and the data. A diagram that shows an admin path straight from a workstation to production contradicts a policy that says all privileged access goes through a PAM, and the contradiction is what gets flagged.
The security architecture review process uses the diagram as its working document: the component-and-connection walk literally follows the boxes and arrows. A current diagram makes the review faster; a missing one makes drawing it the review's first deliverable.
When no current diagram exists, Truvo's security architecture review draws it first, then walks it component by component.
What tools should be used?
For security architecture diagrams, the conventions carry the value; the tool is a preference. draw.io (diagrams.net) is free, produces clean output, and stores diagrams as version-controllable XML, which suits teams that keep architecture documents in a repository. Lucidchart and Visio are the common commercial picks. Whiteboard photos are how diagrams start, not how they ship.
Key insight
Keep the source file, not just the image
Architectures change, and a diagram that cannot be edited gets abandoned rather than updated, which is how organizations end up presenting a two-year-old picture to this year's auditor.
Common security architecture diagram mistakes
- Every host, no hierarchy. Forty boxes of equal weight bury the six that matter. Key components only; detail lives in the inventory.
- No security and monitoring plane. A diagram that omits the SIEM, log paths, and PAM shows how the system works but not how it is defended.
- Unlabeled arrows. An arrow without protocol, port, and direction is decoration. Every arrow earns a label.
- Missing trust boundaries. Without zones, every connection looks equal, and the review cannot see where the control points are.
- Confusing network flow with data flow. Outbound-only connection rules get mistaken for no data leaves, and the diagram hides an exfiltration path.
- Drawn once, never updated. The diagram is a living document. Tie its refresh to change management, or to the annual review cycle at minimum.
Get Your Diagram Drawn and Reviewed
A security architecture review draws the diagram, walks it component by component, and anchors an effective security program.
Frequently Asked Questions
What is a security architecture diagram?
A drawing of a system where boxes represent key components, arrows represent data flows or network flows, zones mark trust boundaries, and annotations record the security controls at each component and crossing. It is the primary working document of a security architecture review and a standard request in audits and customer security reviews.
What is the difference between a network diagram and a security architecture diagram?
A network diagram shows connectivity: devices, links, and addressing. A security architecture diagram overlays the security view: trust boundaries, control points, logging paths, and admin access. Many teams derive the security diagram from the network diagram by adding zones, controls, and the monitoring plane.
Should the diagram show data flow or network flow?
Both, when they differ. Network flow shows the direction a connection is opened, which drives firewall rules. Data flow shows the direction the information of interest travels, which drives data protection controls. A laptop opening an outbound connection that pulls sensitive data back is one line on a network diagram and two on a security architecture diagram.
What level of detail is right?
Enough that a newcomer can trace a request end to end and name every trust boundary it crosses. Key components, labeled flows, zones, and controls; not every host, container, or library. One logical diagram per system, with deeper diagrams only where a component genuinely warrants its own page.
Do auditors require a specific diagram format?
No standard mandates a format. SOC 2 and ISO 27001 audits ask for system and data flow documentation and check it for consistency with policies and evidence. Clear zones, labeled flows, and a visible monitoring plane satisfy the request in any tool.