
.svg)
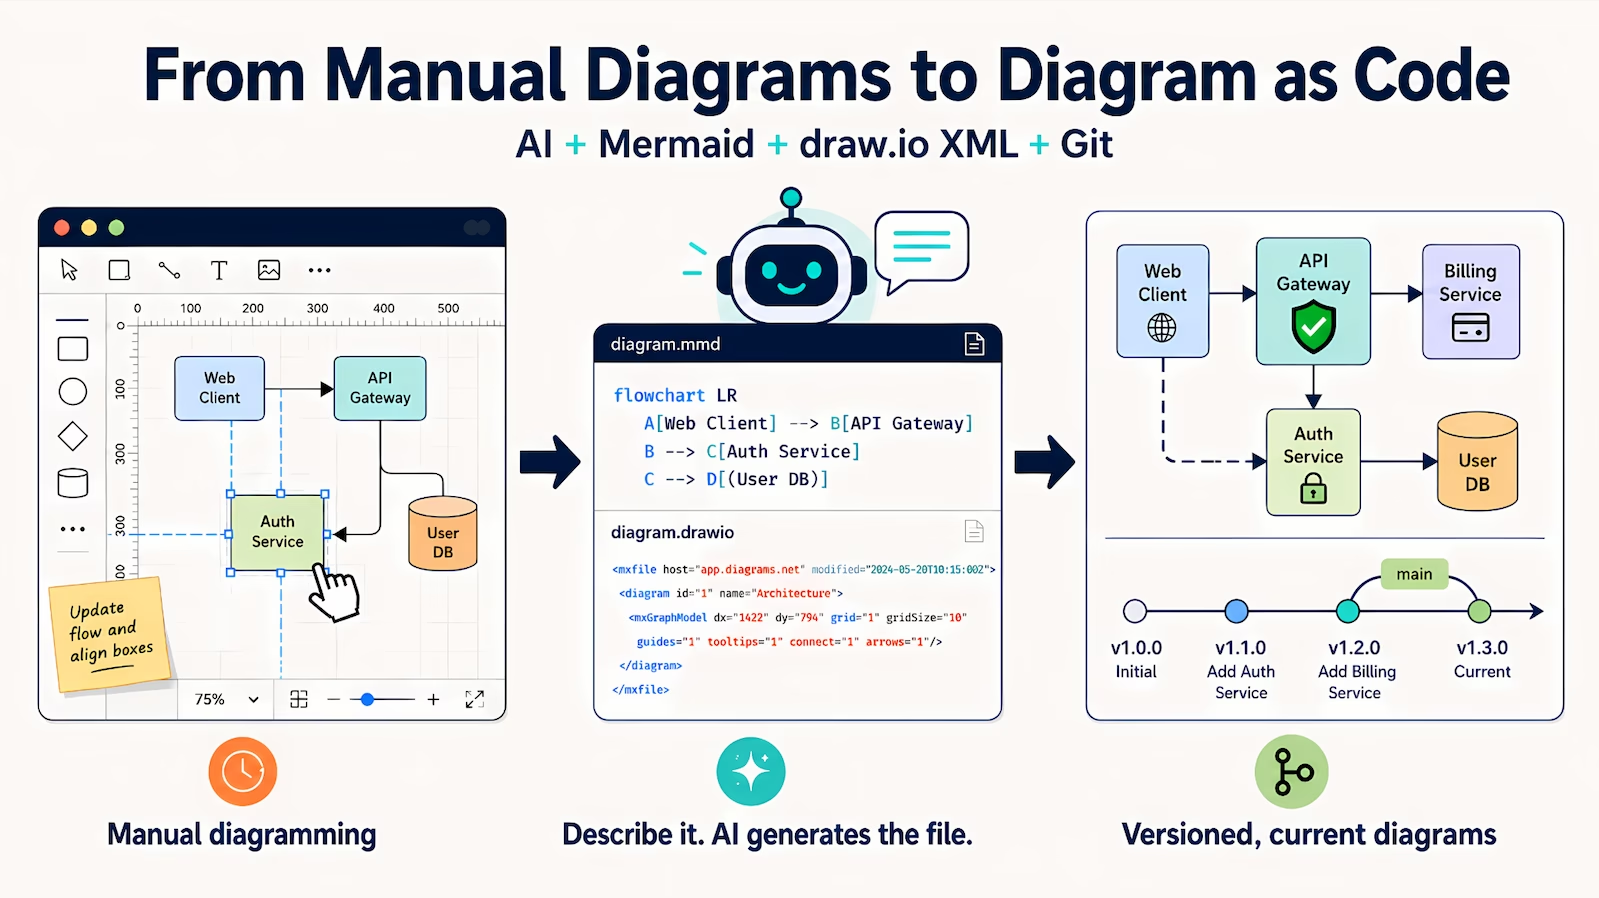
As a cybersecurity consulting firm, one of the first things we do with any client is understand their architecture. That means drawing network diagrams, data flow diagrams, and system architecture documents.
This is a huge amount of work. Making diagrams look good, presentable, and accurate takes hours. You're placing boxes, drawing arrows, aligning things, choosing colors, adjusting labels. Then the architecture changes and you do it all again.
We replaced most of that process with AI-generated diagrams. Here's exactly how.
Why Diagrams Are Painful
The traditional workflow looks like this:
- Sit in a meeting. Listen to the client describe their architecture.
- Open Lucidchart or Visio. Stare at a blank canvas.
- Start dragging boxes. Spend 30 minutes getting the layout roughly right.
- Spend another 30 minutes making it look professional. Colors, alignment, labels, legends.
- Send it to the client for review. They say "actually, the load balancer goes here."
- Redo half of it.
- The architecture changes next quarter. The diagram becomes stale. Nobody updates it because it's tedious.
The Blank Page Problem
The tyranny of the blank page is real. That first iteration, staring at an empty canvas trying to figure out where to start, is the most intimidating part. Especially for junior team members who aren't sure what the diagram should even look like.
The Discovery: Draw.io Files Are Just XML
The breakthrough came when we realized that draw.io files are just XML.
That's it. Under the hood, every draw.io diagram is an XML document describing shapes, positions, connections, colors, and labels. If you can edit XML, you can edit a draw.io diagram without ever opening the GUI.
And AI can edit XML really well.
So now the workflow is: describe the architecture to Claude, reference a previous diagram as a template, and Claude Code generates a new draw.io file from scratch. The result is a proper, editable diagram that anyone can open in draw.io. No special tools. No paid subscriptions.
Two Approaches: Mermaid and Draw.io
We use two different approaches depending on the diagram type.
Mermaid for Data Flows
Mermaid is a text-based diagramming syntax. You write something like:
graph LR
A[Client] --> B[Load Balancer]
B --> C[App Server]
C --> D[Database]
```

And it renders as a clean diagram.
For data flow diagrams, Mermaid is nearly perfect. The output needs virtually no manual editing. You describe the flow in plain language, Claude generates the Mermaid syntax, and you get an accurate, readable diagram.
Mermaid is great for:
- Data flow diagrams
- Sequence diagrams
- Simple architecture overviews
- Process flows
- Anything where the relationships matter more than the physical layout
The limitation is that Mermaid controls the layout automatically. You can't manually position elements. For diagrams where the spatial arrangement matters (like network diagrams showing physical or logical topology), you need more control.
Draw.io XML for Everything Else
For diagrams where layout matters, we generate draw.io XML directly.
Claude generates the complete XML: shapes, positions, connections, styles, colors, labels. The output opens directly in draw.io as a fully formed diagram.
Template-Driven Consistency
We maintain templates from previous engagements. When starting a new diagram, we point Claude at a similar previous diagram and say "generate a new one based on this template with these changes." The consistency across client deliverables is automatic.
Our Color Convention for Network Diagrams
We use a color system for traffic risk that Claude applies consistently:
This convention makes network diagrams immediately readable. You can glance at a diagram and understand the risk profile of each traffic path without reading labels.
Claude nails these colors every time. Once we established the convention in a template, every subsequent diagram follows it automatically. No more "wait, what color did we use for DMZ traffic?"
Where AI Gets It Right and Where It Doesn't
Honest assessment:
Nearly Perfect: Data Flow Diagrams
Mermaid diagrams for data flows are almost always production-ready on the first generation. The relationships are what matter, and AI understands relationships well. You might tweak a label or reorder a flow, but the structure is solid.
Good Enough to Start: System Architecture
Draw.io system architecture diagrams come out 70-80% right. The components are correct. The connections are correct. The groupings (VPC, subnets, availability zones) are correct. The layout needs some manual adjustment, but the bones are solid.
Needs Human Finishing: Network Diagrams
Network diagrams are the hardest. The physical or logical topology, the routing, the spatial arrangement of devices, these still require a human eye. AI gets the right components in roughly the right places with the right colors. But the layout needs manual tweaking to be truly clear.
The Real Win
That manual finishing takes 10-15 minutes instead of starting from scratch, which takes an hour or more. The blank page problem is gone. The template is generated. The color conventions are applied. You're polishing, not creating.
The Full Stack (And What It Costs)
The complete diagramming setup:
- Draw.io: Free and open source. Desktop app or browser.
- Claude Code: Generates and edits diagram XML.
- GitHub: Stores diagrams with version control.
- Mermaid: Free. Renders in GitHub, VS Code, and most documentation tools.
Total cost: whatever you're already paying for Claude.
We cancelled our Lucidchart subscription. No more per-seat pricing. No more usage limits. No more commercial tool dictating how we do our work.
The Collaboration Tradeoff
The one area where Lucidchart and Miro are genuinely better is real-time collaboration. Multiple people editing the same diagram simultaneously is smoother on those platforms.
For our team, it's not a dealbreaker. We version control the files in GitHub and take turns. If someone needs to edit a diagram, they pull the latest version, make changes, and push. Git handles the rest.
If your workflow depends heavily on live multi-user editing, that's a real tradeoff to consider. For most small teams, it's not an issue.
What Clients Get
Clients don't care how we make diagrams. They care that the diagrams are accurate, delivered fast, and stay current.
Faster delivery. A first draft that used to take an hour appears in seconds. The polishing still takes human judgment, but the total time drops dramatically. That means clients get architecture documentation earlier in the engagement, not as an afterthought weeks later.
Diagrams that stay current. Because updating a diagram is trivial (edit the XML or regenerate from an updated description), diagrams actually get updated when the architecture changes. No more "this diagram is from six months ago, things have changed." The documentation stays in sync with reality.
Consistent quality. Color conventions, layout patterns, and labeling standards are encoded in templates. Every client gets professional, readable diagrams with the same visual language. No variation depending on who drew it or what mood they were in.
Client access. The diagram files live in the client's GitHub repo. They can open them in draw.io anytime, make their own edits, or share them with their team. No "can you send me the Lucidchart link" and no licensing issues.
Editing Without the GUI
Even after a diagram exists, we can modify it without opening draw.io. Need to change a label? Update a color? Move a component? Tell Claude what to change in the XML and save the file.
This sounds minor, but it adds up. When you're managing diagrams across a dozen client engagements, being able to make batch changes through code instead of clicking through a GUI for each one saves significant time.
Architecture Reviews, Automated
We build effective security programs with documentation that stays current.
Getting Started
If you want to try this:
- Start with Mermaid. Pick a data flow or process flow you need to create. Describe it to Claude or ChatGPT and ask for Mermaid syntax. Paste it into the Mermaid Live Editor and see what comes out. You'll be surprised.
- Try a draw.io generation. If you have draw.io installed, ask Claude to generate a simple architecture diagram as a draw.io XML file. Open it. The first time you see a full diagram materialize from a text description, the old workflow will feel absurd.
- Establish color conventions early. Pick a color system for your diagrams and encode it in a template. Once AI has the convention, every diagram will be consistent automatically.
- Version control your diagrams. Put them in a Git repo. The ability to see what changed between diagram versions is surprisingly useful, especially when client architectures evolve over time.
This is part of our Consulting as Code series.
More in this series:
- What Is Consulting as Code?
- GRC Engineering: What It Looks Like in Practice
- Google Search Console API + Claude
- Down With .docx, Long Live .md
Frequently Asked Questions
What is diagram as code?
Diagram as code is the practice of defining architecture diagrams, data flows, and network diagrams using text-based syntax or structured markup (like Mermaid or draw.io XML) instead of dragging shapes in a GUI tool. The diagram definition lives in a file that can be version-controlled, generated by AI, and rendered into a visual diagram on demand.
Can AI generate draw.io XML files directly?
Yes. Draw.io files are XML documents that describe shapes, connections, positions, colors, and labels. AI models like Claude can generate complete draw.io XML from a text description of the architecture. The output opens directly in draw.io as a fully editable diagram, no conversion or special tooling required.
Is Mermaid or draw.io XML better for architecture diagrams?
It depends on the diagram type. Mermaid is ideal for data flows, sequence diagrams, and process flows where the relationships matter more than spatial layout. Draw.io XML is better for network diagrams, system architecture, and any diagram where the physical or logical positioning of components matters. We use both depending on the deliverable.
Can diagram as code replace Lucidchart or Visio?
For most small to mid-size teams, yes. Draw.io is free and open source, and AI-generated XML eliminates the blank-page problem that makes manual diagramming slow. The one area where commercial tools still have an edge is real-time multi-user collaboration. If your team doesn't need simultaneous editing, diagram as code covers everything else at zero licensing cost.
How do you keep AI-generated diagrams consistent across projects?
Templates. We maintain draw.io XML templates from previous engagements with established color conventions, layout patterns, and labeling standards. When generating a new diagram, we reference a previous template so AI applies the same visual language automatically. Version control in Git ensures every team member works from the same templates.